Power and Effect Size
Calculating Power using G*Power
If you haven’t already, you will need to download and install the free program G*Power from this website:
Link to GPower: http://www.gpower.hhu.de/ Scroll down the page to the Download section. There is a version available for Windows and Mac operating systems. You can also download the GPower manual if you want a copy of it. You can also find a link to the GPower download site, the manual, and some helpful links for using GPower on the course D2L site.
Once you have GPower installed, open the application. Gpower has a series of drop down menus where you select the test and statistic you need, and then input the necessary information.
The Test Family box is where you select the test family you need. Most often (for this course), you’ll likely be selecting t-test or F-test.
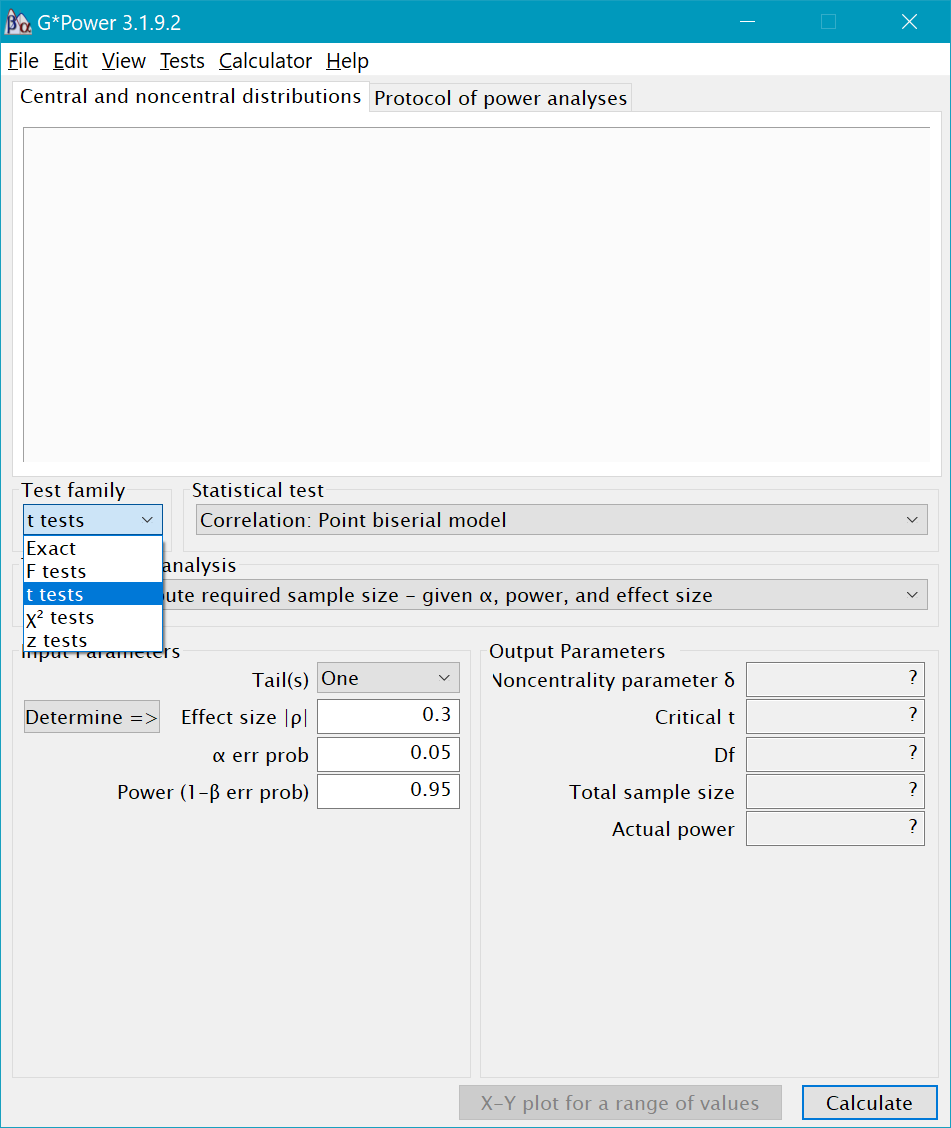
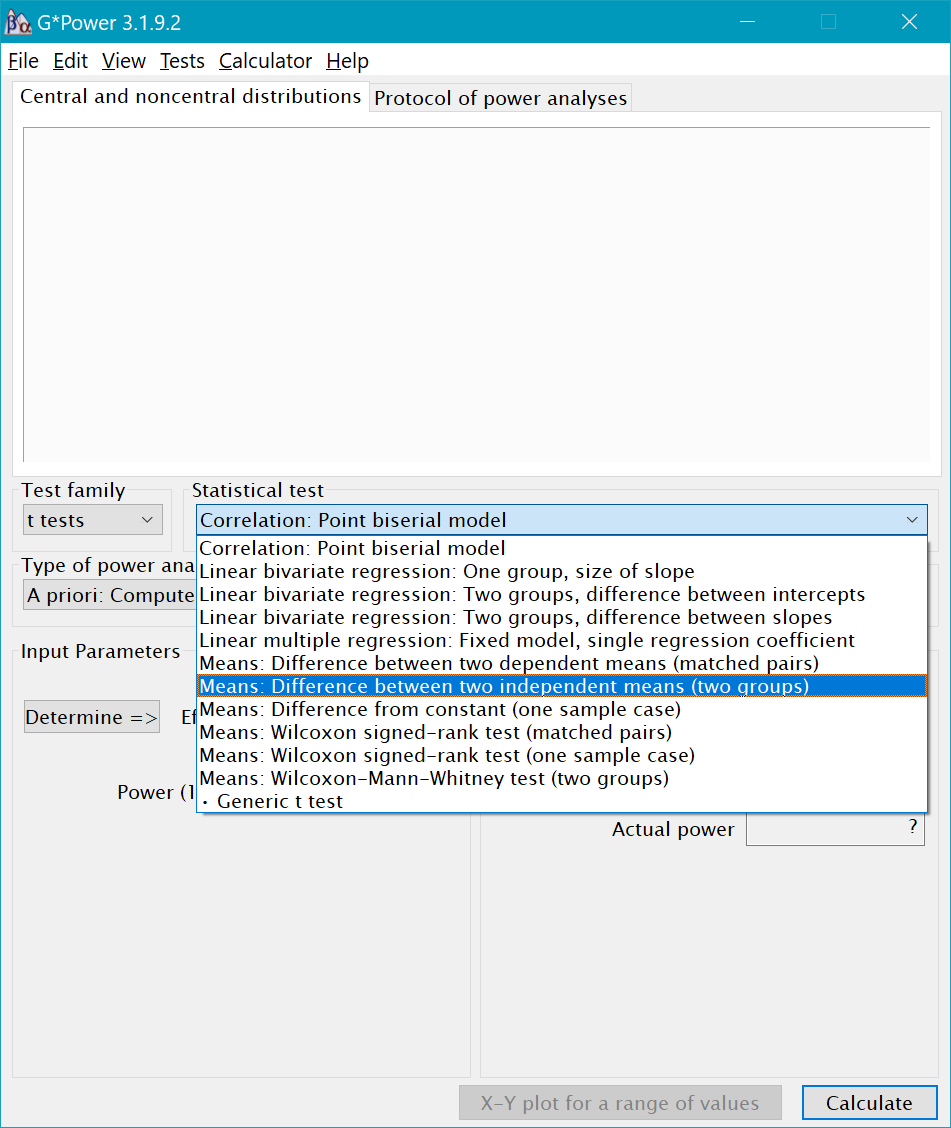
After you select the test family, you then need to select which type of Statistical Test within that family you need. For example, within the t-test family, we could select Means: Differences between two independent groups or Means: Differences between dependent groups. There is also the option to calculate power for non-parametric t-tests, as well as linear regression models.
Once you’ve selected the statistical test, the next step is to select the Type of Power Analysis we want to conduct. In general, you should only conduct power analyses apriori–that is, before you collect data. GPower gives you several other options in addition to apriori. For example, you can calculate post-hoc power, but post-hoc power analyses are not actually informative. But you could use the post-hoc option to determine if the sample size you plan to collect will give you enough power to detect an effect of a hypothesized size.
The next step is to enter Input Parameters. This includes selecting whether you want a one-tailed or two-tailed test (use two-tailed), the effect size, the alpha level, and the level of power you want (usually .80 or .90). For t-tests, there is also an allocation ratio box that represents the ratio of participants in each of your groups (a ratio of 1 means that the groups are equal in size; ratio of 2 means one group is 2x the size of the other).
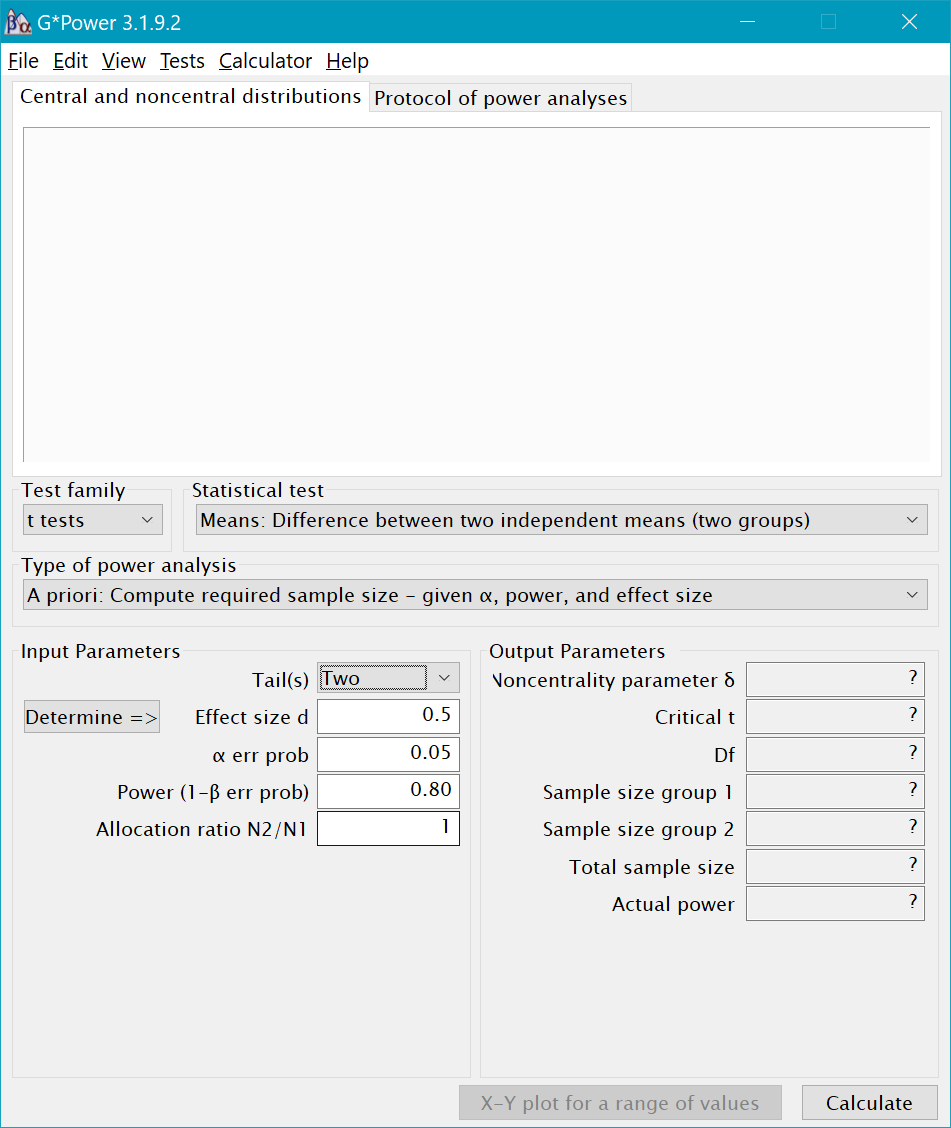
- What is the total sample size required to achieve 80% power (two-tailed) for an independent samples t-test where the anticipated effect size is d=.50? What is the total sample size required for 90% power?
Plotting with GPower
Another helpful feature of GPower is the ability to create power plots. After running a power analysis, click on the box called “X-Y plot for a range of values.” A new window will open. The top white box is where the plot will appear. The bottom box contains the Plot parameters. You can plot sample size, effect size, or power on the y-axis or x-axis. You can also select the range of values you want to see on your plot.
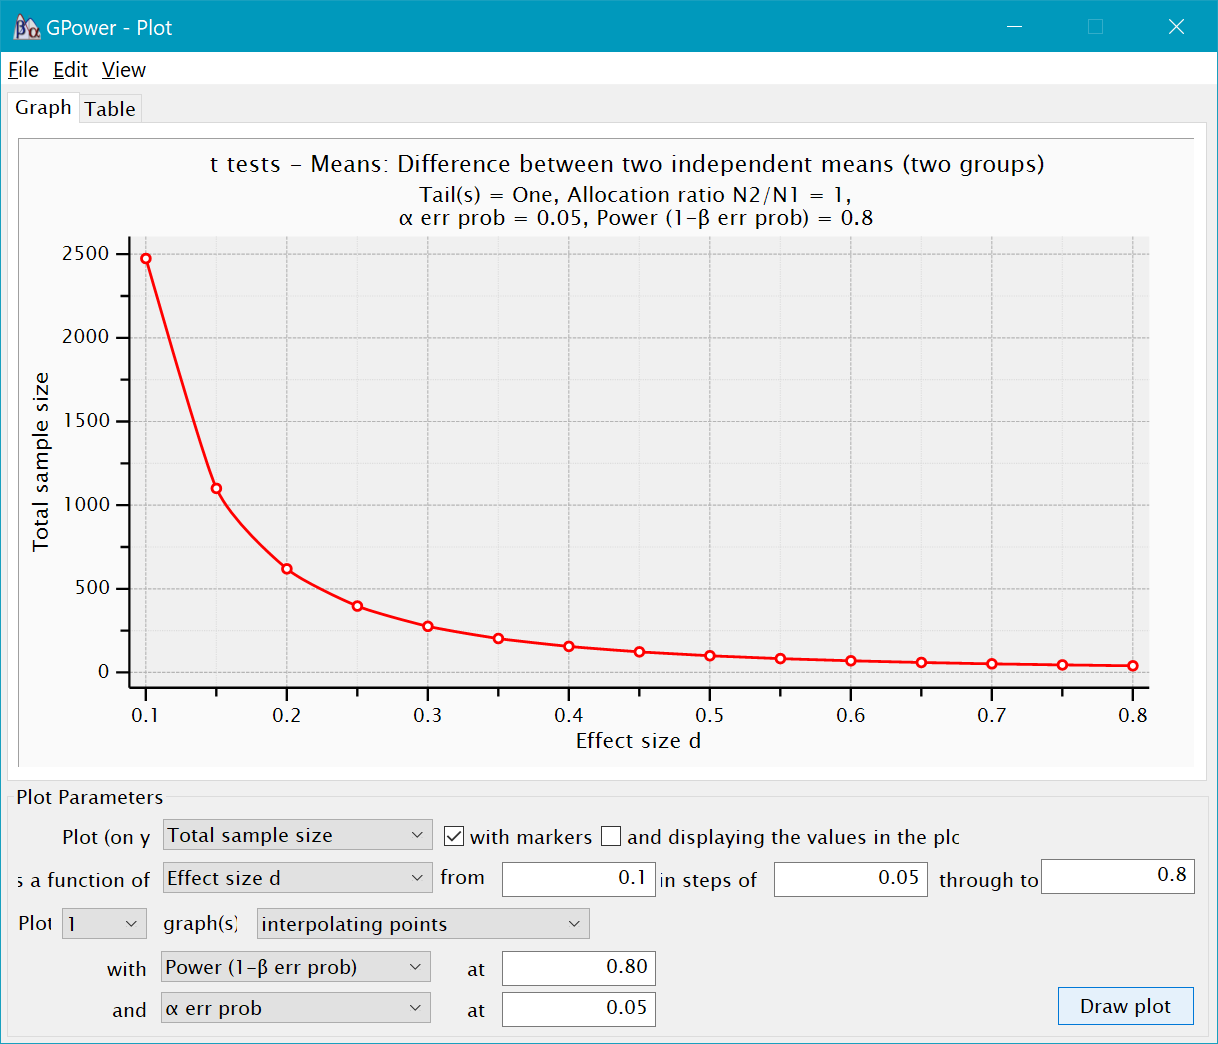
- Create a plot with sample size on the y-axis and power on the y-axis, using a medium effect size and alpha=.05. What happens to power as the sample size increases?
Calculating Effect Sizes
The package we will use to calculate effect sizes this semeseter is called MOTE. MOTE stands for Measure of the Effect. The package was created by Dr. Erin Buchanan, who runs the Statistics of Doom YT channel. MOTE has the capability to calcualte a wide variety of effect sizes, including effect sizes for t-tests and ANOVAs.
You’ll need to install the package for MOTE if you haven’t already.
install.packages("MOTE")
A Shiny App for MOTE was also recently released: ShinyApp: https://doomlab.shinyapps.io/mote/ With the ShinyApp, you select the type of effect size you need, and then are prompted to enter all of the required numbers. Then the app runs the R-code in the background and calculates the effect size for you.
For this week, we will MOTE within R to calculate effect sizes.
Cohen’s d for Independent t-tests
The effect size for a comparison involving two independent groups is Cohen’s d. Cohen’s d is calculated by subtracting the means of the two groups and dividing by the pooled standard deviation.
`
Effect size convetions for Cohen’s d for Independent Groups
| d | Size of the effect |
|---|---|
| .2 | small |
| .5 | medium |
| .8 | large |
Let’s return to the Smoking and Health dataset from last week and re-run the independent samples t-test. If you are working in an R project and have not cleared your Environment, the dataset (with the changes we made) should still be available. If not, re-open your .rmd file from last week and re-run everything.
To use MOTE to calculate d, we will need the means, standard deviations, and *n*s for each group.
tmod <-t.test(general_health~smoker,
       data=smoking_noout,
       var.equal=TRUE)

#Descriptive Stats by Group
smoking_noout %>%
  group_by(smoker) %>%
  summarize(mean = mean(general_health, na.rm = TRUE),
            sd = sd(general_health, na.rm = TRUE),
            n = n())
Now we have easy access to the descriptive statistics and can enter the numbers into the code below to calculate d.
library(MOTE)

d.ind.t(m1, m2, sd1, sd2, n1, n2, a = 0.05)
d.ind.t(m1, m2, sd1, sd2, n1, n2, a = 0.05)$estimate  #gives d with 95% CI
Cohen’s d for Dependent t-tests
The formula for a dependent t-test is almost exactly the same as it is for indpenendent groups.
For dependent t-tests, there are a couple of options for selecting the denominator. The first option is to use the SD of the difference scores as the denominator.
d.dep.t.diff(mdiff, sdiff, n, a=0.05)

d.dep.t.diff(mdiff, sdiff, n, a=0.05)$estimate
Another way to calculate d with repeated measures data is to use the average SD in the denominator.
d.dep.t.avg(m1, m2, sd1, sd2, n, a = 0.05)
So which one should you use? Both are valid ways of calculating d for dependent t-tests. However, the averaging method may be slightly less biased than the difference score method. The SD of the differences tends to be smaller than the average of the two SDs, so an effect size calculated with the difference SD may be positively biased. When you report the d-statistic for a dependent t-test, just be sure to say which method you used.
- Calculate Cohen’s d for the dependent t-test from last week.